
Project Overview
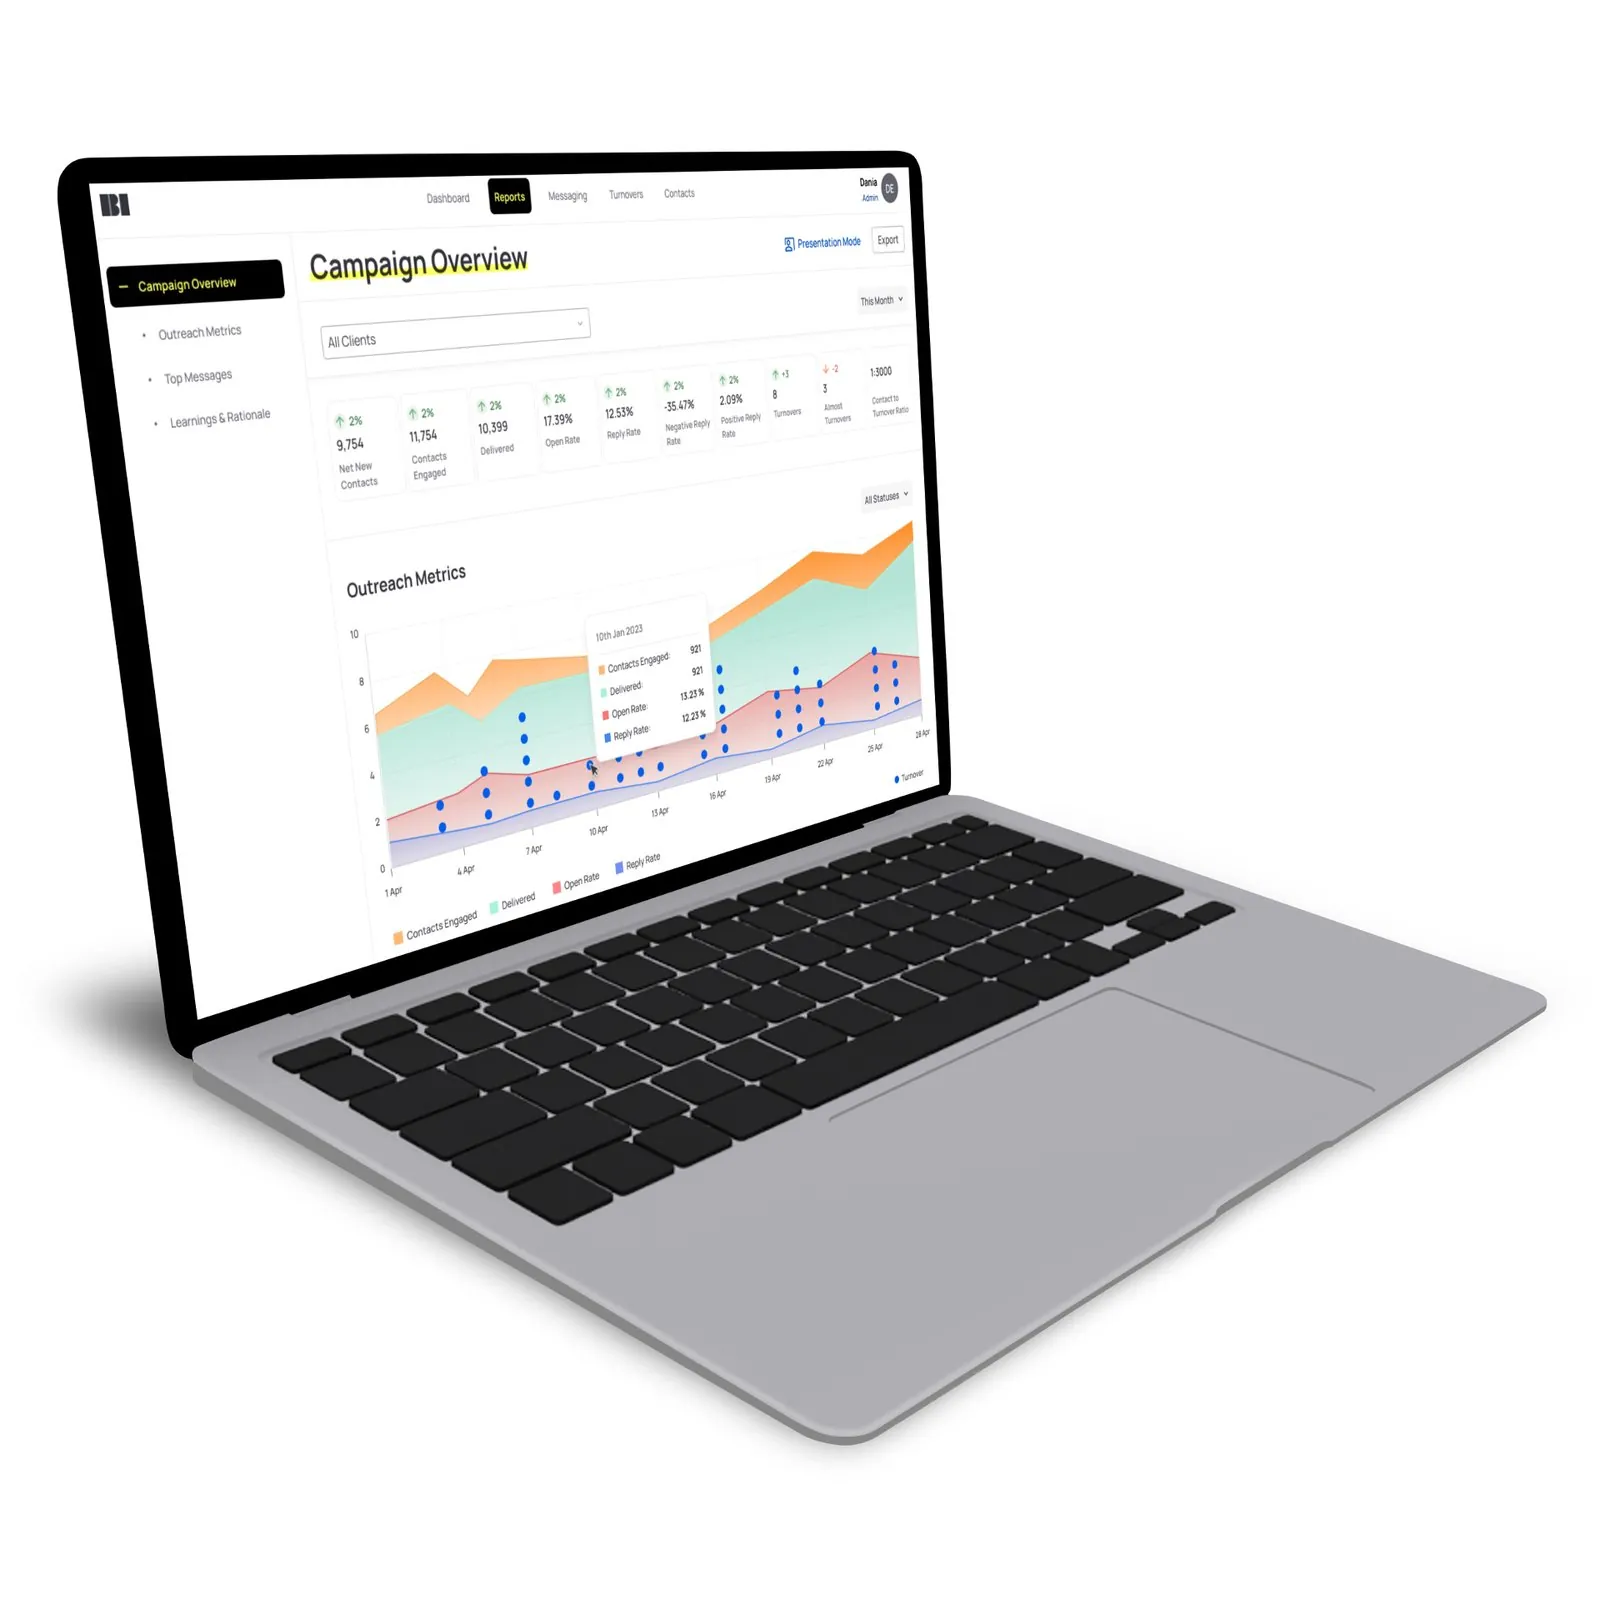
As Lead Designer on this project, together with Ivica Marinac, a Product Designer at Symphony, I worked with Demand Inc., one of the most innovative companies in their industry, renowned for pushing the boundaries in sales development and client engagement. They approached us with a clear goal: to create a Business Intelligence (BI) tool that would revolutionize how their teams manage outreach and optimize performance.
Demand Inc. was looking for a solution that would provide real-time data visibility, actionable insights, and streamlined reporting to give their sales teams and clients a competitive edge. It was my role to ensure that the product not only met these needs but also delivered an intuitive user experience that aligned with their vision for innovation and growth.
Problem Statement
Despite their leadership in the industry, Demand Inc. faced a challenge: they lacked actionable insights into their outreach efforts. Without the ability to track key metrics or optimize email campaigns, their sales teams were missing opportunities for better engagement and conversions.
We needed to develop a tool that could:
- Provide detailed visibility into key performance indicators (KPIs), such as open rates, reply rates, and the effectiveness of message cadences.
- Offer transparent, real-time reporting for both internal teams and clients.
- Enable sales teams to adjust their outreach strategies based on data, driving higher engagement and conversion rates.
My Role & Approach
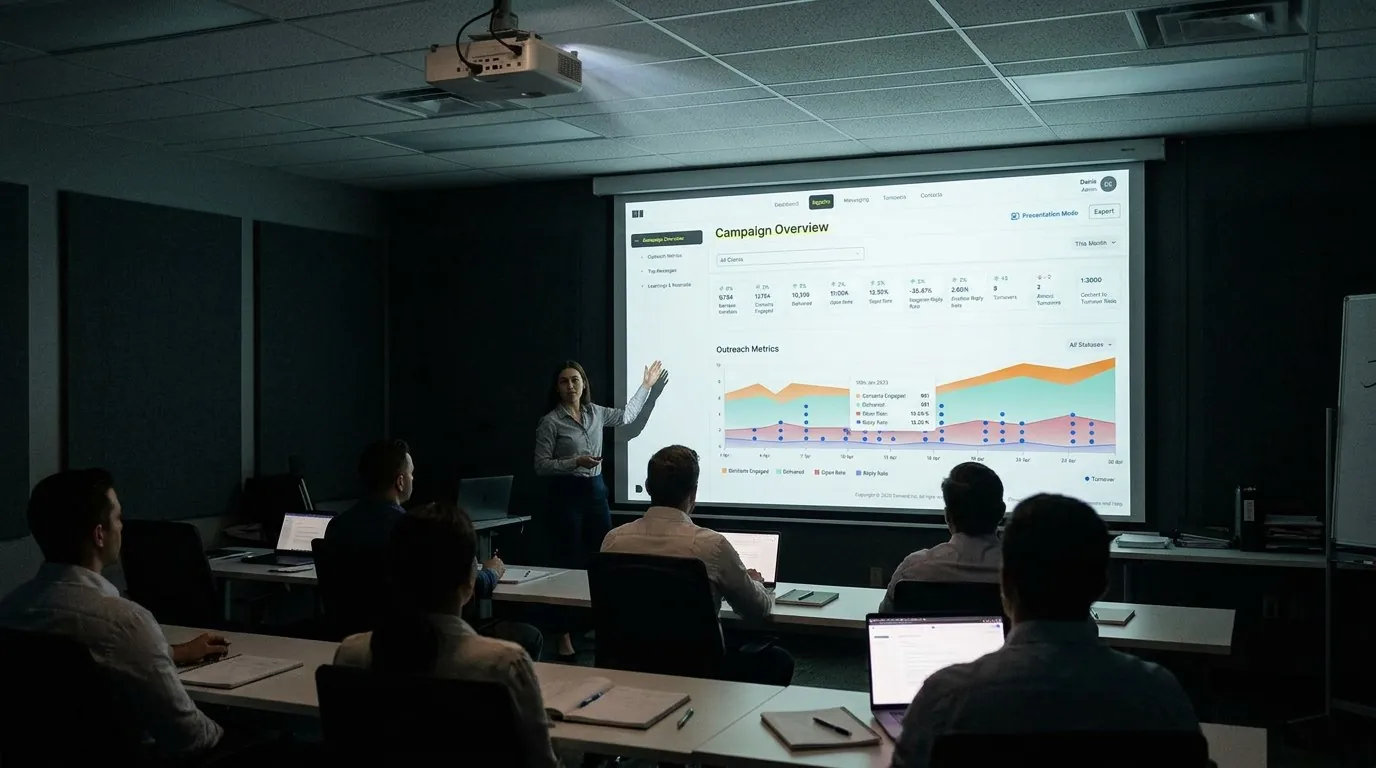
From the beginning, I worked closely with Demand Inc.’s leadership to understand their unique vision and goals. Together with Ivica Marinac, who co-designed the product with me, and our Solution Architect, I was involved in both the research and development (R&D) phase and product design. The Solution Architect took the lead on the technical side, ensuring scalability and performance, while I focused on the product’s design and user experience.
Our collaboration was key to ensuring that the technical architecture supported the functionality and ease of use that Demand Inc. needed. My role was to ensure that the design allowed users to access actionable insights seamlessly without being overwhelmed by the complexity of the data.
Key Contributions
- Product Conceptualization: I played a critical role in defining the product’s vision, ensuring that the design would not only solve current challenges but also anticipate future needs in sales engagement.
- Wireframing & UX Design: I developed wireframes that outlined the core features (Turnovers, Messaging, Client Management and the Leaderboard), ensuring that user needs were at the forefront and aligned with the technical capabilities.
- Scalable Role Hierarchy: Together with the Solution Architect, we designed a flexible role-based system that catered to the diverse user types within Demand Inc., including Business Developers, BD Managers, Clients, and Admins. This system allowed each role to access relevant data without clutter, maintaining a clean and efficient user experience.
Challenges We Faced
- Designing a Scalable Role Hierarchy: As Demand Inc. grew, the tool needed to grow with them. We had to ensure that the role-based system provided meaningful insights to Business Developers, offered managers oversight of team performance, and delivered clear engagement data to clients.
- Seamless Data Integration: It was crucial to integrate data from multiple sources (email metrics, client turnover, and outreach strategies) to offer a unified view of sales performance. I worked with the Solution Architect to ensure that these data sources were connected without compromising user experience.
- Balancing Complexity and Usability: One of the biggest challenges was ensuring that the tool provided advanced insights without overwhelming users. My focus was on designing an intuitive interface that allowed users to quickly access the most important insights.
Key Features Developed
Turnovers Tracking
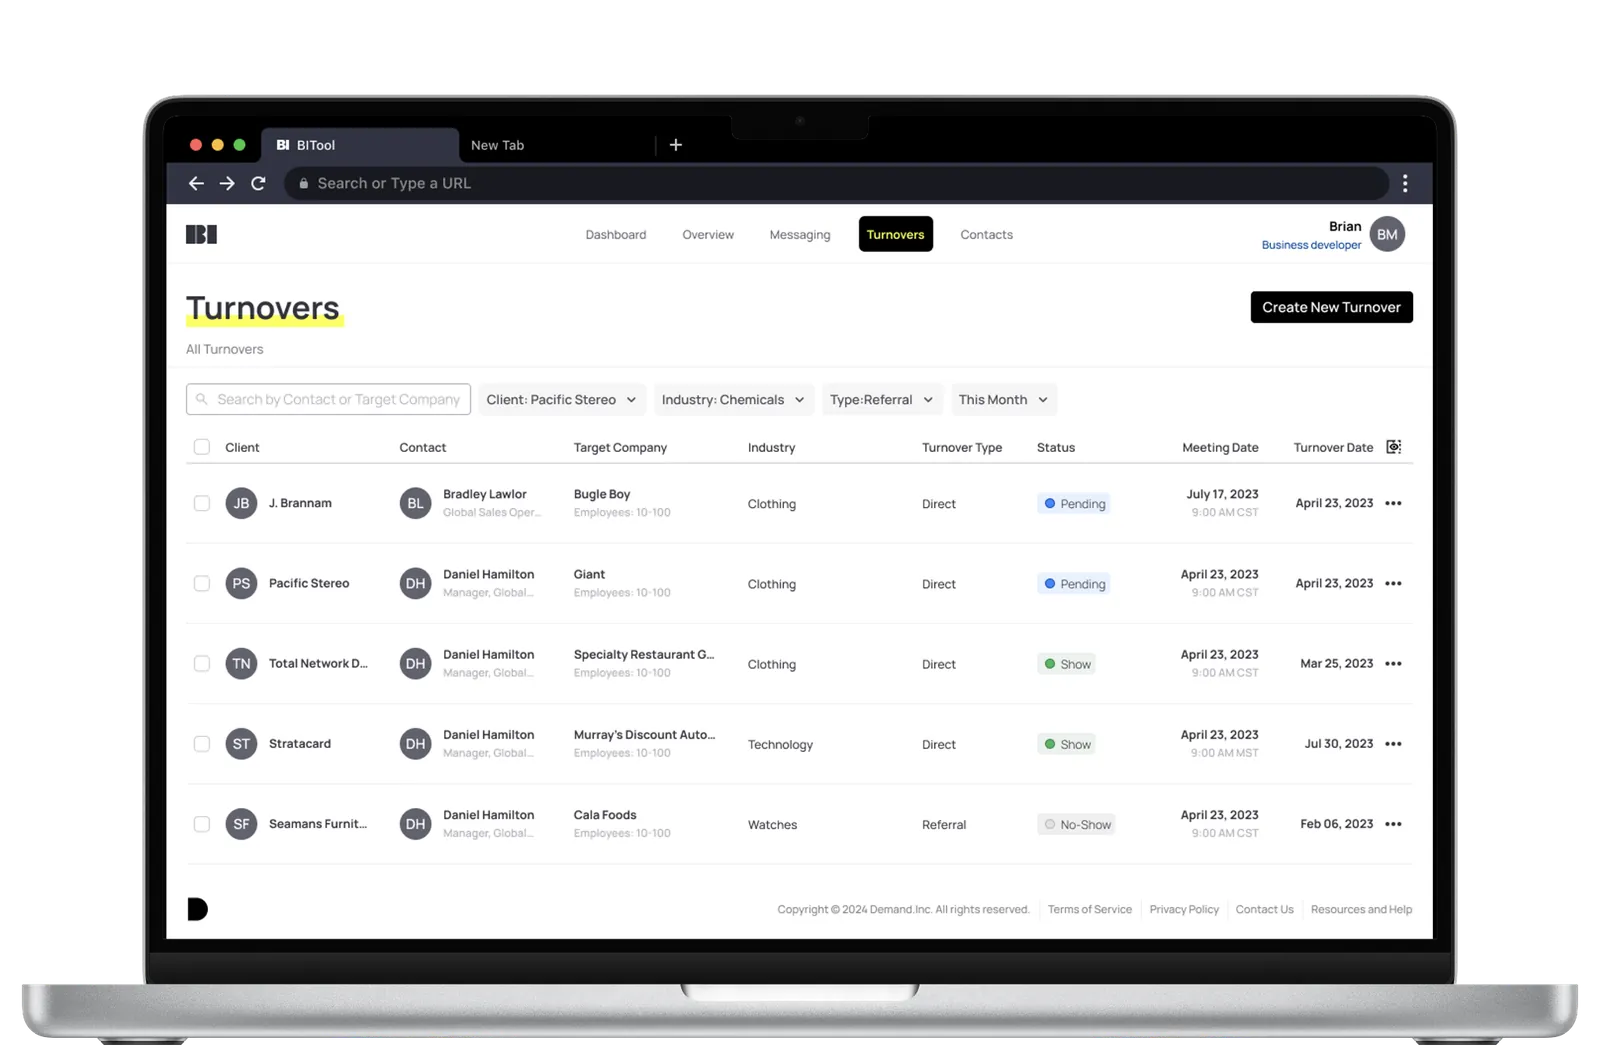
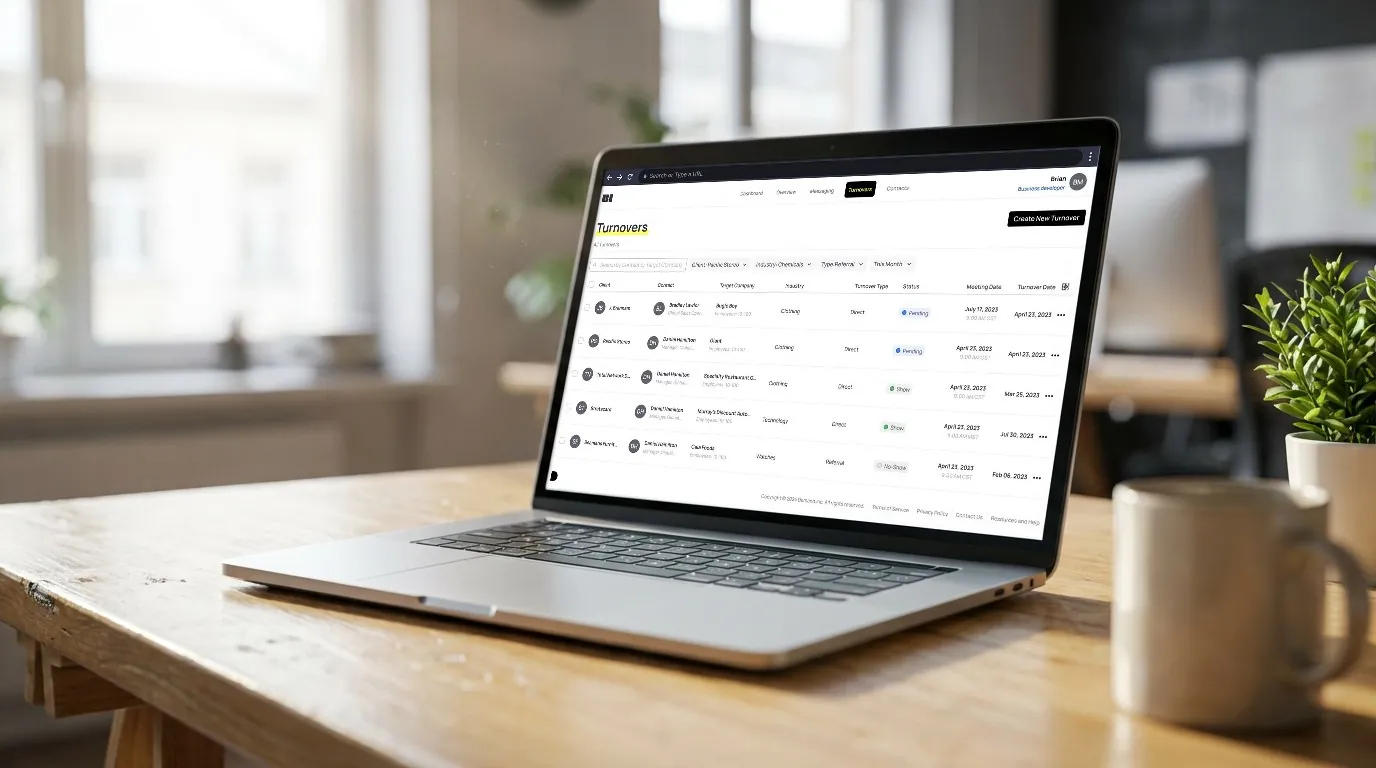
We developed a Turnovers feature that gives users a detailed view of client turnovers, allowing them to filter data by timeframe, industry, and role. This helps the team identify risks and optimize client retention and performance.
Messaging Performance Analysis
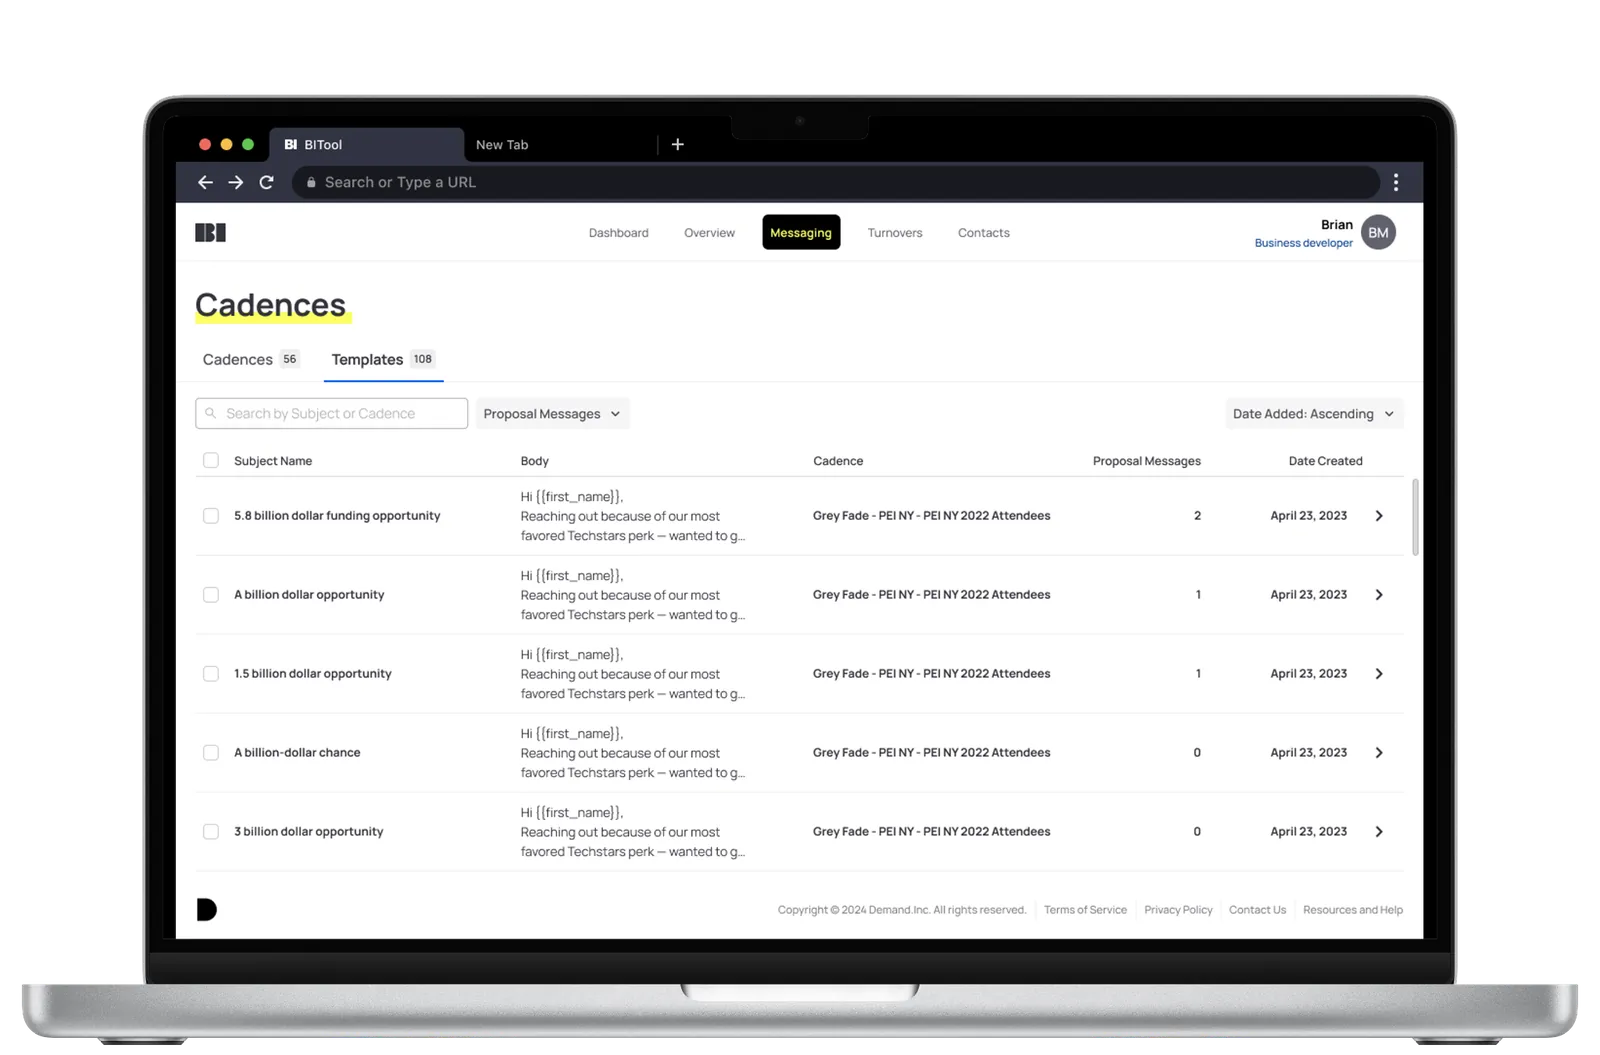
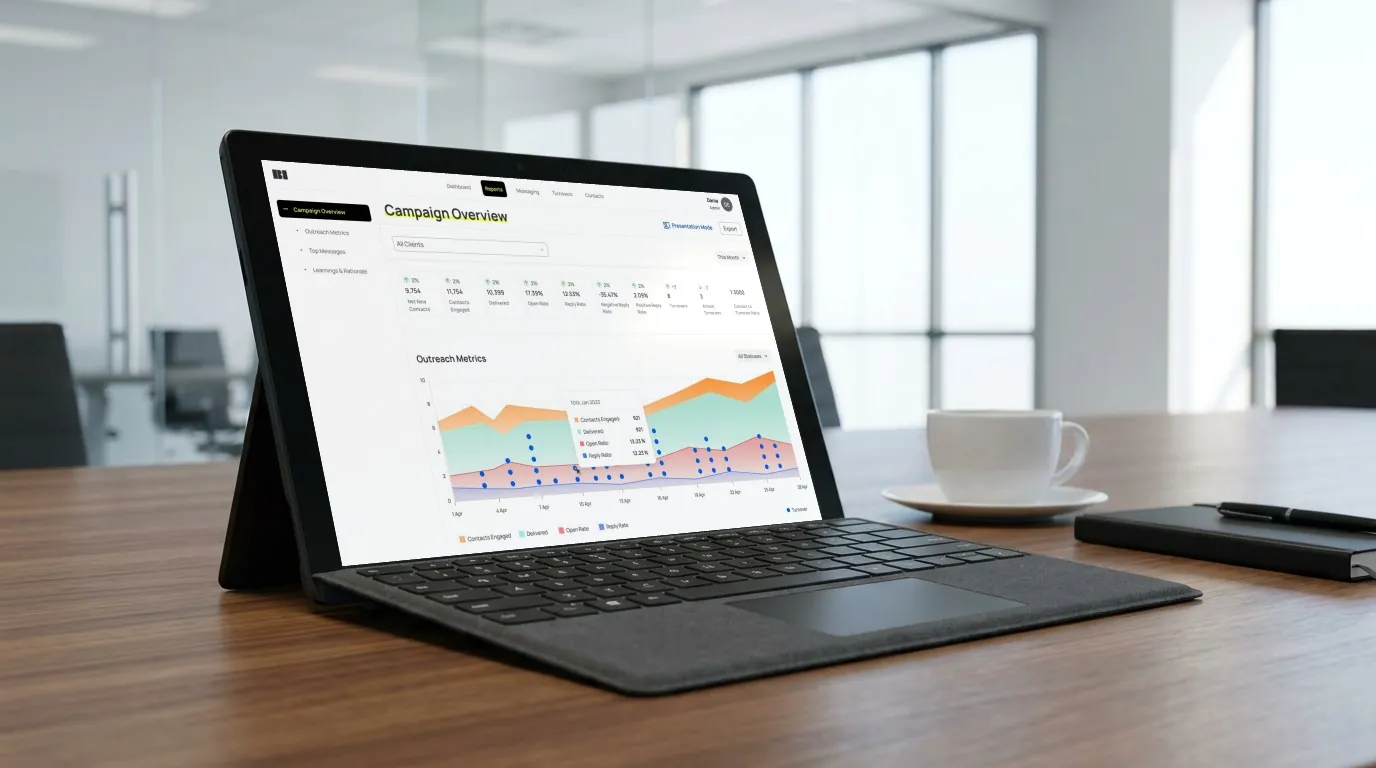
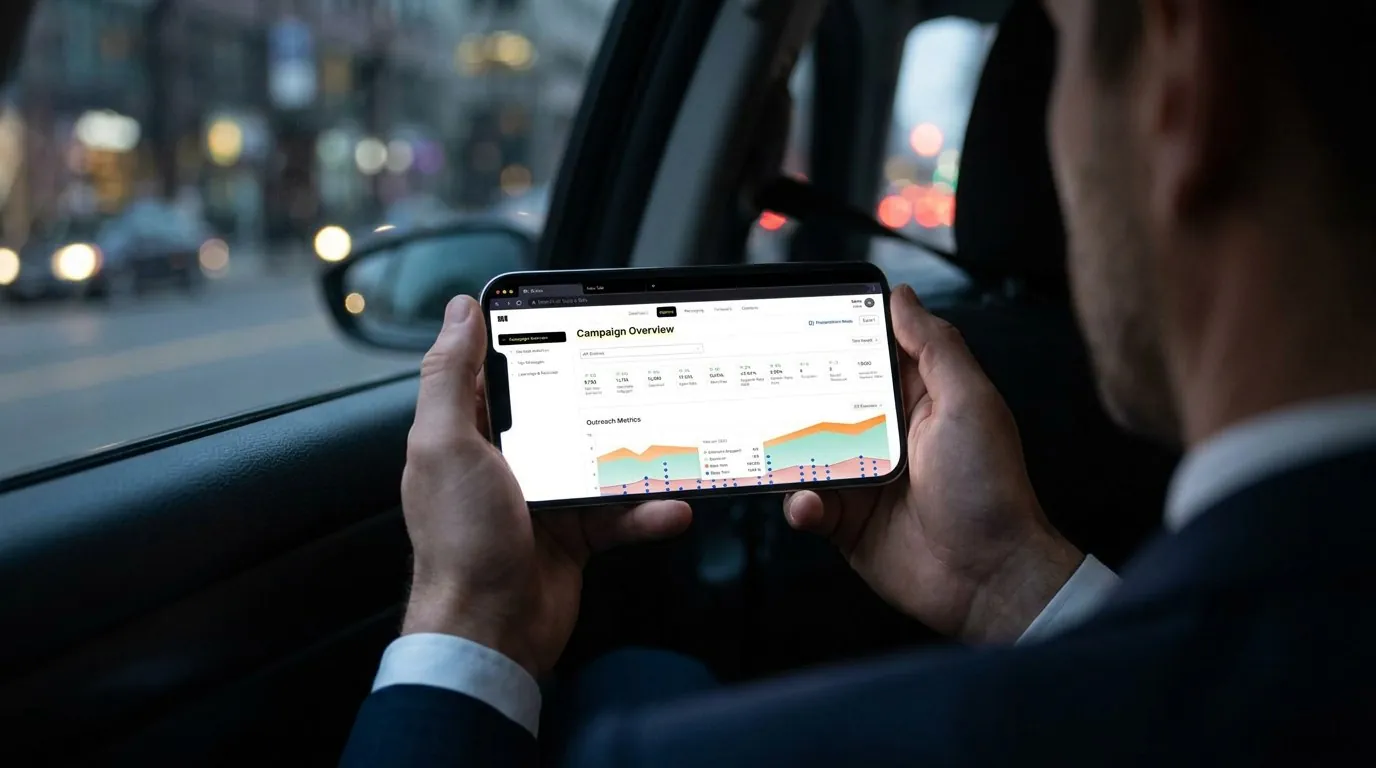
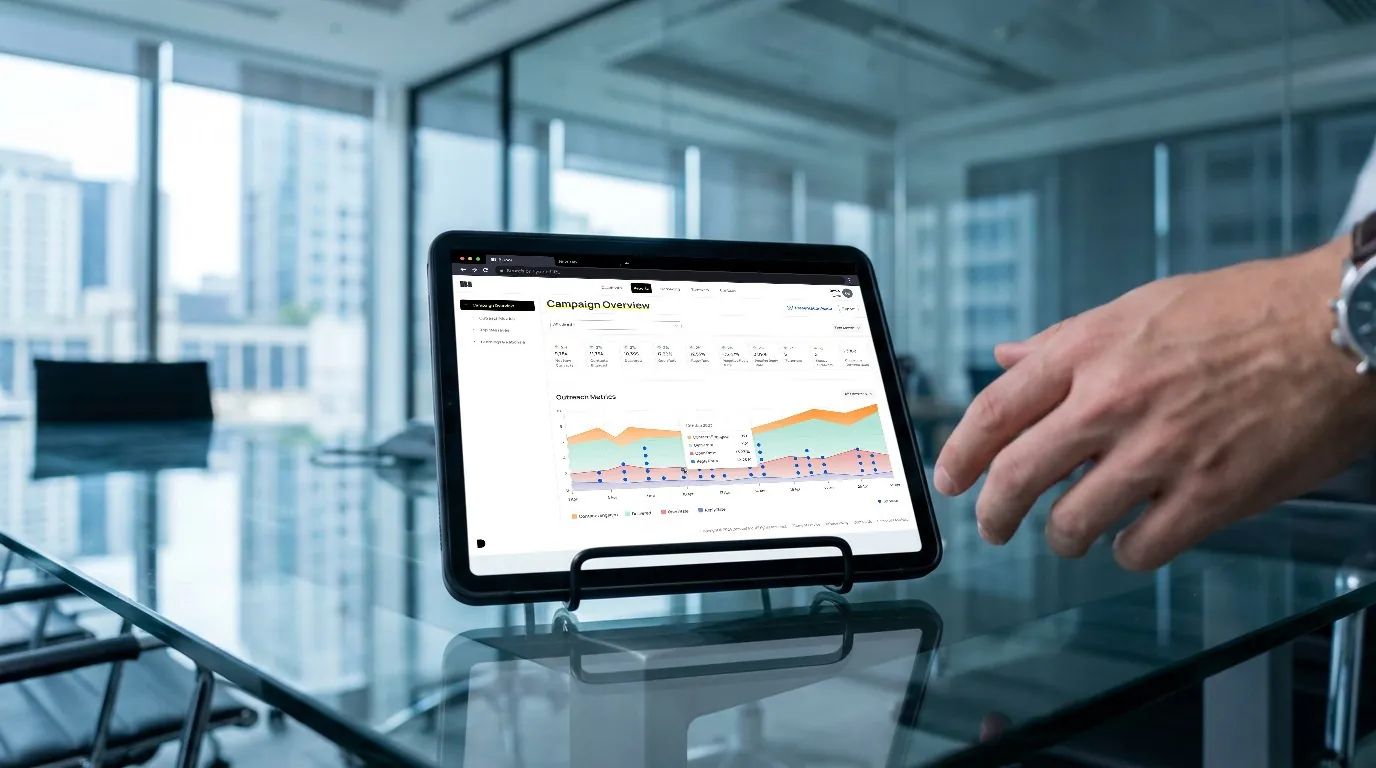
The Messaging feature I designed allows users to track email campaigns in real-time, monitor open and reply rates, and use sentiment analysis to assess the tone of communications. This provides valuable feedback to help teams improve their messaging strategies.
Client Management & Transparency
We created a centralized Client Management module that provides Business Developers and clients with full visibility into engagement history, turnover metrics, and performance statistics. The goal was to foster stronger relationships by providing clients with real-time dashboards.
Leaderboard for Team Motivation
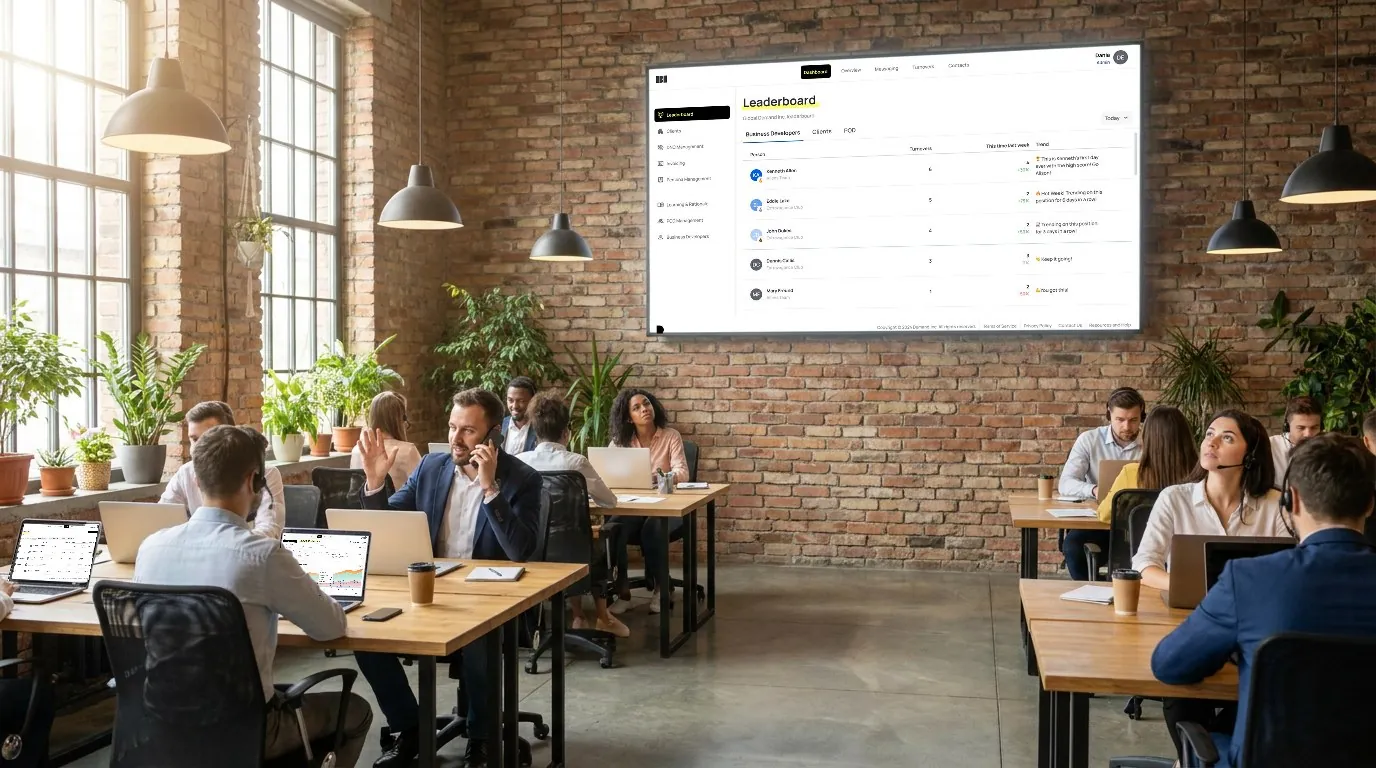
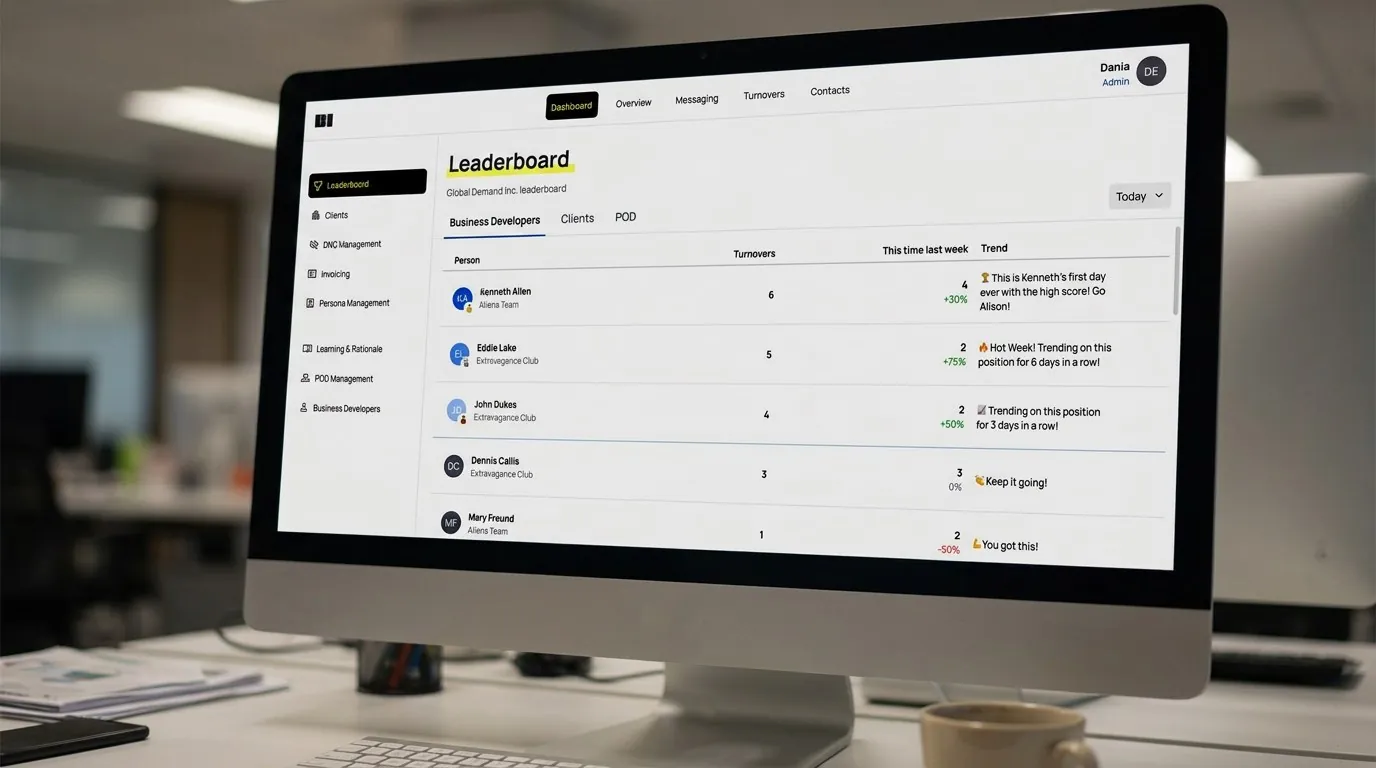
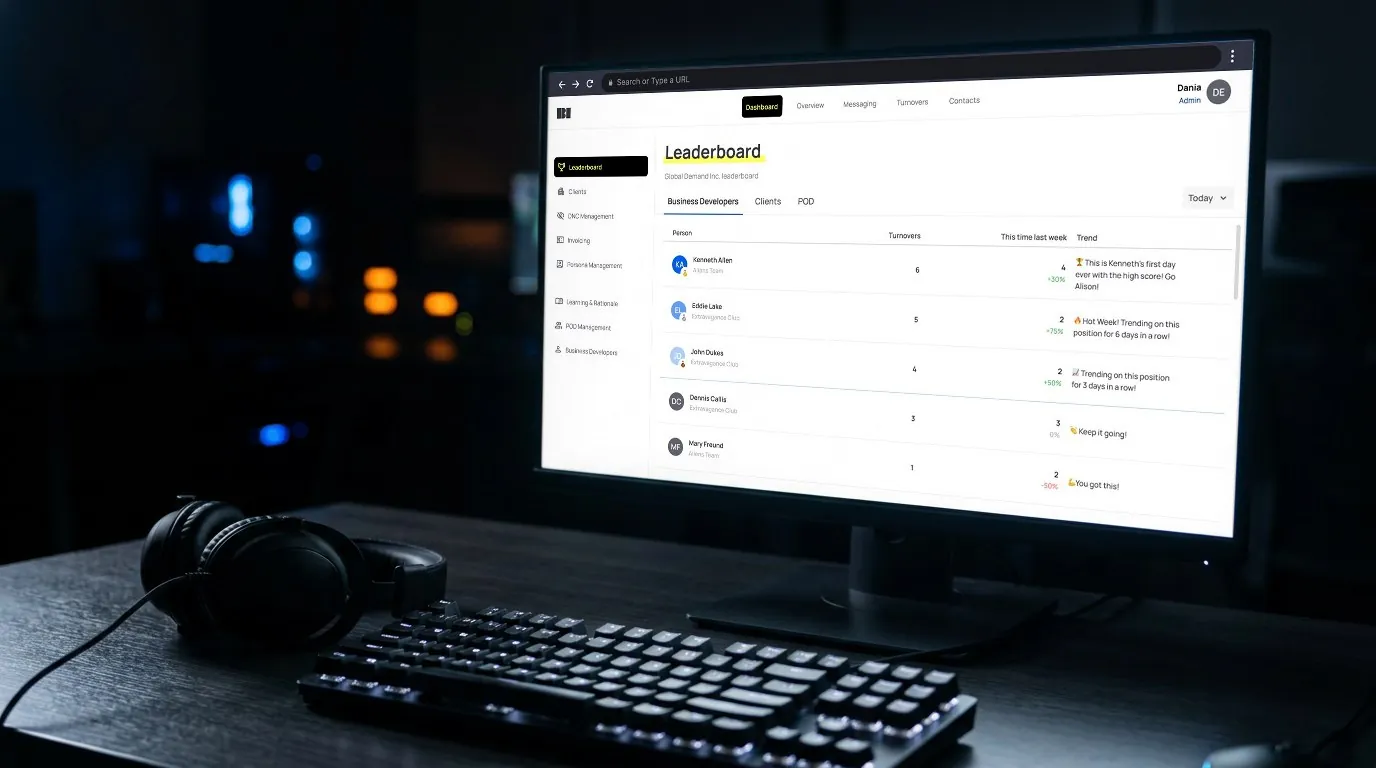
To encourage a competitive yet collaborative environment, I designed a Leaderboard feature that allows Business Developers to compare their performance with peers, driving higher engagement.
Learning & Rationale Documentation
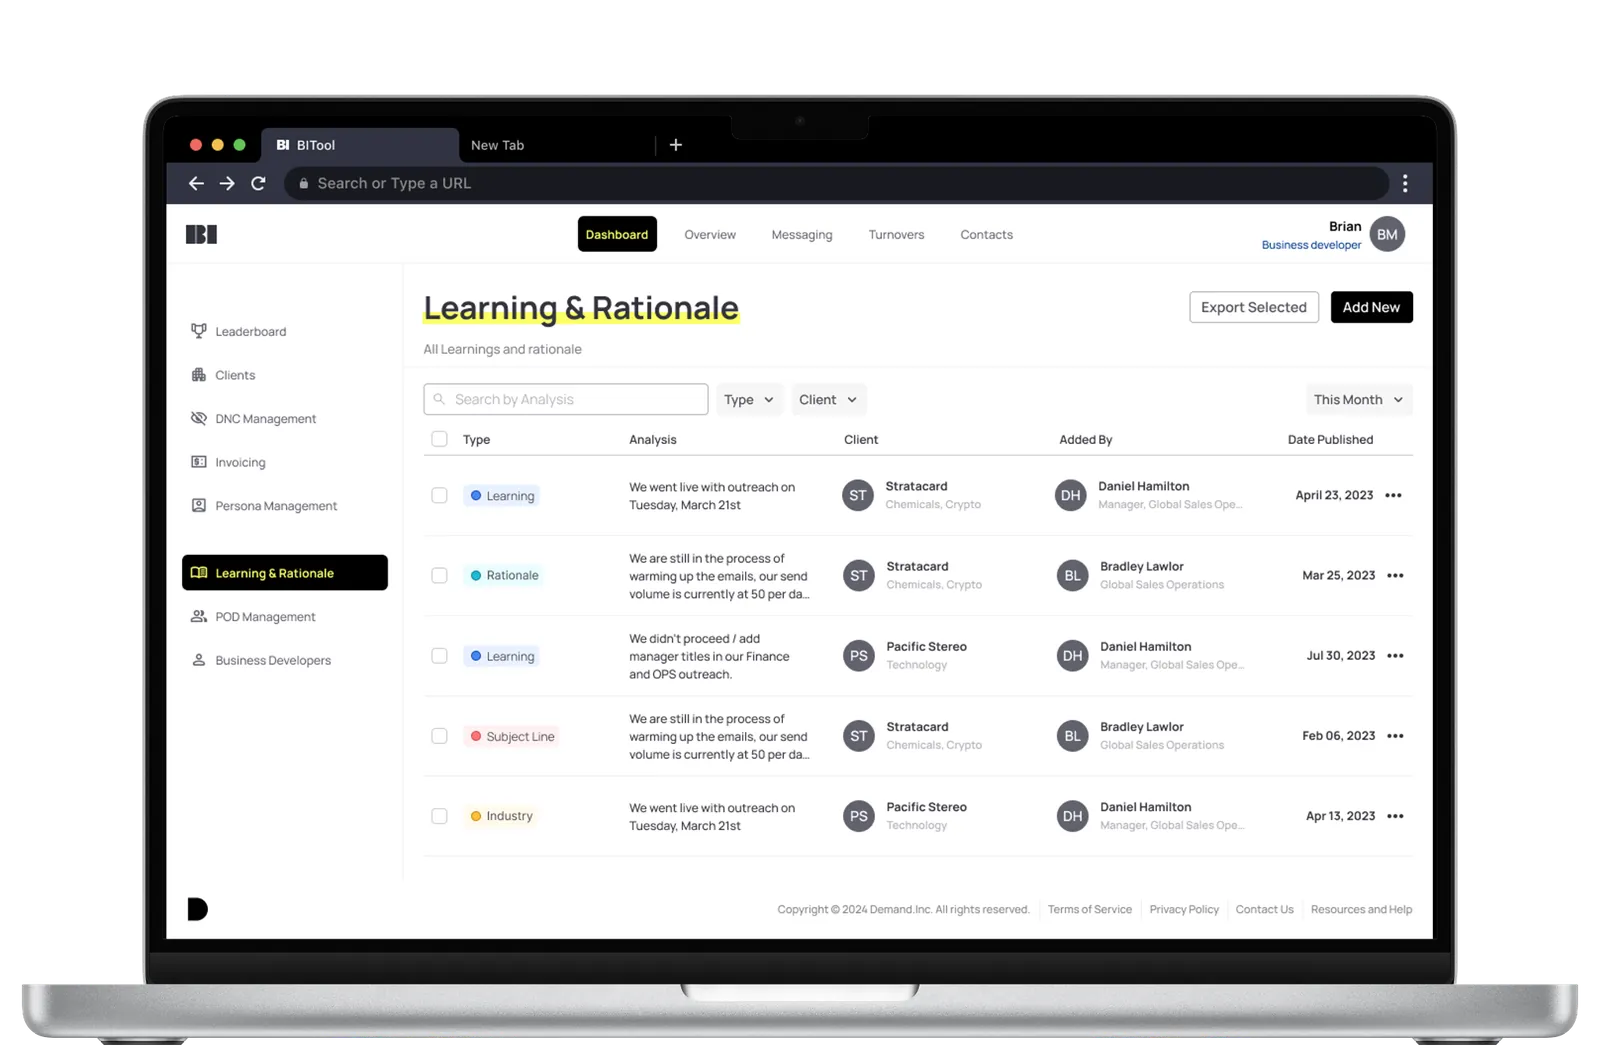
I introduced a Learning & Rationale module where Business Developers can document key insights from their outreach campaigns, helping Demand Inc. build a knowledge base that informs future strategy and continuous improvement.
Web App
Outcomes & Impact
The BI tool launched and is in use at Demand Inc. I have no figure I can vouch for, so these outcomes are described in words:
- Enhanced Sales Efficiency: Thanks to the real-time insights the tool provides, Business Developers can now optimize their outreach strategies more effectively, leading to improved conversion rates and more streamlined workflows.
- Strengthened Client Relationships: Clients now have access to real-time engagement data, fostering greater transparency and trust. The dashboards we created keep them fully informed on the progress of their campaigns, improving satisfaction.
- Data-Driven Decision Making: BD Managers can monitor team performance in real-time and allocate resources more strategically. The tool’s reporting features enable informed decision-making that supports Demand Inc.’s growth.
- Increased Team Motivation: The introduction of the Leaderboard has inspired healthy competition within the team, resulting in boosted productivity across the board.
Lessons Learned
Working closely with Demand Inc. on this project reinforced several key takeaways:
- Designing for Scalability: From the outset, we prioritized scalability, ensuring that the tool could grow with Demand Inc. and continue to meet their evolving needs.
- User-Centered Design is Crucial: Balancing the complexity of the data with an intuitive user experience was critical to ensuring the tool’s success and adoption across different user types.
- Collaboration Drives Innovation: Close collaboration between our product team and Demand Inc.’s stakeholders was essential in aligning the tool’s technical capabilities with the business objectives, allowing us to deliver a product that met their high standards for innovation.
Details
- Since then
- Sports Business Journal reported the tool on 19 December 2023: it automates client reporting the company used to compile by hand, and took about 11 months to build.
- Years
- 2023
- Industry
- Sales
- Tools
 Figma
 Miro
 ChatGPT
- Fields
- App Design, Product Design, UI/UX
- Elsewhere
- Demand Inc. (demandinc.co)
Team
 Miroslav KostićLead Designer
- Ivica MarinacProduct Designer